Monte Carlo Simulations for Magic: The Gathering

What is a Monte Carlo simulation⌗
Monte Carlo simulations are a way to generate a forecast - a set of predicted scenarios with an associated probability of occurring. Forecasts crucially need both. Monte Carlo simulations are a powerful way to model a wide spectrum of phenomena, from estimating pi or e, the natural number, to weather predictions and fission energy production. In fact, the Monte Carlo method was developed by Neumann and associated at Los Alamos during research on the Manhattan Project to simulate atomic collisions in fission reactions.
A Monte Carlo simulation works by assigning multiple values to a single variable to achieve multiple results and then averaging the results to obtain an estimate of the given outcome. So, for example, if we wanted to model the rate of land draws on a variety of land compositions, we could do that, and then weight the following outputs to determine a most-likely outcome based on each given land composition. Or we could model the likelihood of drawing into a combo with n number of cards.
This is all necessary because Magic is a stochastic process. You can’t know how a game will turn out until you’ve played it through even with perfect knowledge of all game state, which you don’t normally have anyway. Because of the random order of cards, the choices of players, and in-game sources of randomness like coin flips, each game is a fingerprint of a set of decks in a given sequence of time.
Setup⌗
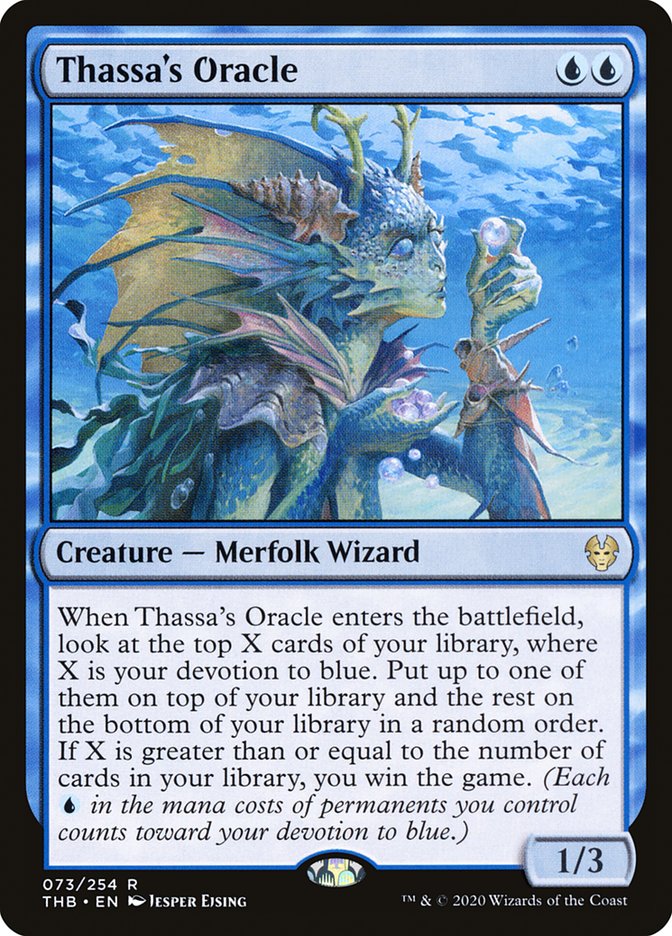
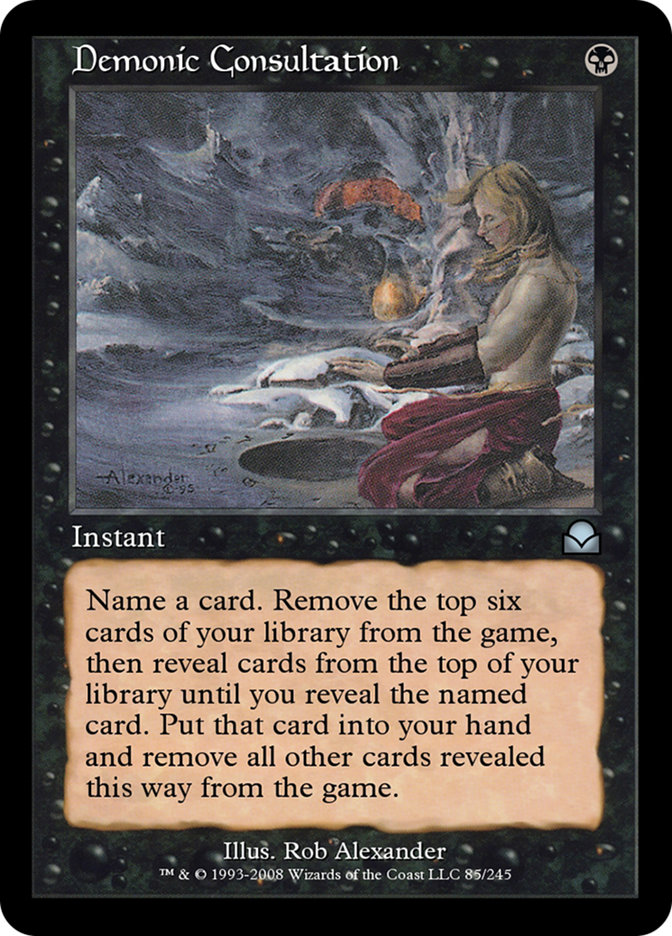
To start, I setup a Monte Carlo simulation that modeled a 2 card win condition (let’s say it’s our bff Thassa’s Oracle/Demonic Consultation) in the 99 of a deck with 37 land cards.
The simulations showed an average draw-to-win of 41 after drawing the initial 7 cards, meaning that for a 2 card combo, you have to dig down an average of 41 cards after your opening hand. That’s nearly half your deck! This presents an interesting heuristic: each card you need to assemble requires roughly 20 cards of draw. This is why draw engines are so important in Magic. A player must be able to reliably dig for their answers. And indeed, 25 cards of draw is certainly viable inside of 10 turns with Commander decks in 2024.
📊 run 1:
attempts:10000000
averageDrawsToWin:41.1818897
openingHandWins:42858
averageOpeningHandWins:0.0042858

📊 run 2:
attempts:10000000
averageDrawsToWin:41.1782581
openingHandWins:43136
averageOpeningHandWins:0.0043136

📊 run 3:
attempts:10000000
averageDrawsToWin:41.1805479
openingHandWins:43163
averageOpeningHandWins:0.0043163
Cranking the sample space from 1,000 up to 10,000,000 produces no significant difference in the numbers.
Second combo lines⌗
Adding the ability to detect a second combo line lets us tweak the numbers more in that direction. With a single 2 card combo in the deck, it takes an average of 41 draws after our initial 7 card hand is drawn before we hit both of our win conditions. With the addition of a second combo line, so two 2-card combos, we drop that down to about 35 cards, an improvement of about 1 card.
What’s interesting is that the difference between 1,000 and 1,000,000,000 yielded a difference of about 1 card on average difference between this simulations. There is much greater variation in the opening hand wins, too. This is a good demonstration of how Monte Carlo simulations are sensitive to the number of scenarios run to find their numbers.
🔮 mtg-sim booting up
📊 results @ 1000 scenarios
{attempts:1000 averageDrawsToWin:34.907 openingHandWins:23 averageOpeningHandWins:0.023}

📊 results @ 1000000 scenarios
{attempts:1000000 averageDrawsToWin:35.14745 openingHandWins:16102 averageOpeningHandWins:0.016102}
Opening hand wins⌗
Opening hand wins are defined as both cards needed for the win condition being in the first 7 that you draw, no mulligans. This definition doesn’t account for whether you’d have the mana to play the combo either, which would drastically decrease the likelihood of a true opening hand win. Instead this metric is meant to provide insight into the raw likelihood of having your win con in hand at any point in the game and disregards the mana side of that equation. With that definition, the simulation data showed that you have about .04% chance, or 4 hands in every 1000 will contain your two combo pieces. When the number of combo lines is increased from 1 to 2 (for 4 combo pieces total) the odds get slightly better at about 1.7%.
Mulligans⌗
Mulligans have been completely ignored for the purposes of this simulation because the intent is to see how a given set of cards influences the cards you draw, and mulligans are subject to that first. This is meant to give a better sense of how the probabilities work out rather than how one can shape a deck with mulligans. Indeed, the data does suggest that mulligans would be extremely important in Commander because of the relatively low average land count in a given hand. Mulligans for better land distributions are therefore very likely, and that’s before accounting for even rocks, dorks, combo pieces, etc… that are extremely important to a 3 turn game plan for a given 7 draw hand.
Limitations and configuration⌗
The simulator currently only distinguishes between lands and non lands, and only non lands can be combo pieces. There’s a configurable number of required combo pieces, number of lands per deck, and number of combo pieces included. The simulator also doesn’t care about lands being drawn, only combo pieces. Instead, the land/non-land distinction has been added for future sampling of opening hands and land drop curves.
Synthesis⌗
Turning the number up of combo pieces up to 4 but with 1 of each required for each line decreased the average draw count down to 35, an ~14% reduction in draws. This means that adding two additional combo cards to your existing combo lines is the same as adding approximately 6 cards worth of draw. This is a surprising result to me, since it suggests that adding redundant combo pieces to your deck is less beneficial than it might first seem. The analysis doesn’t account for whether or not the cards are in the proper zone, or even if the cards are the right combination of the combo pieces, but it does offer insight into the raw likelihoods of drawing them in the first place, which is often the hardest part.
When looking at opening hand wins, the likelihood of drawing your combo in your opening hand is about 0.016%, or a of a percent chance. Increasing this to 4 combo pieces as in the second set of runs increased the chance to about 1.7%. There’s some investigation around mulligans to be done here to see how a second combo line effects mulligan choices before I think one can definitively say whether the addition of a second combo line is really worth it. There is enough data here to give me pause before adding another, though.
Next steps⌗
The next step are tracking land counts in opening hands and landfall curves in general, the effects of tutors on average draw counts, mulligans and shaping opening hands, and how mana rocks and dorks might effect mana availability.